4.2. Dashboard
Central Management's Dashboard gives a general overview of Central Management and its instances status.
Auto screen refresh
The default refresh rate of the information displayed is 30 seconds.
Overview page
The Overview page shows information abot
-
Proportion of the licensed to the total number of Core instances,
-
Proportion of the Core instances that has engine update issues to the total number of Cores,
-
What products and how many instances are connected to the Central Management,
-
Aggregated number of objects processed by the managed instances.
Update history
The Update history shows information about every update-related event.
On the Update history page, you can also search for engine name, package type or message content. Also, you can filter the list for severity.
There is an option to export update history in CSV format. For the export, the filters will be applied, you can filter by date and type of Severity. After the filters are selected, you can download the history by click on "Export to CSV" button.

Export with Microsoft Edge
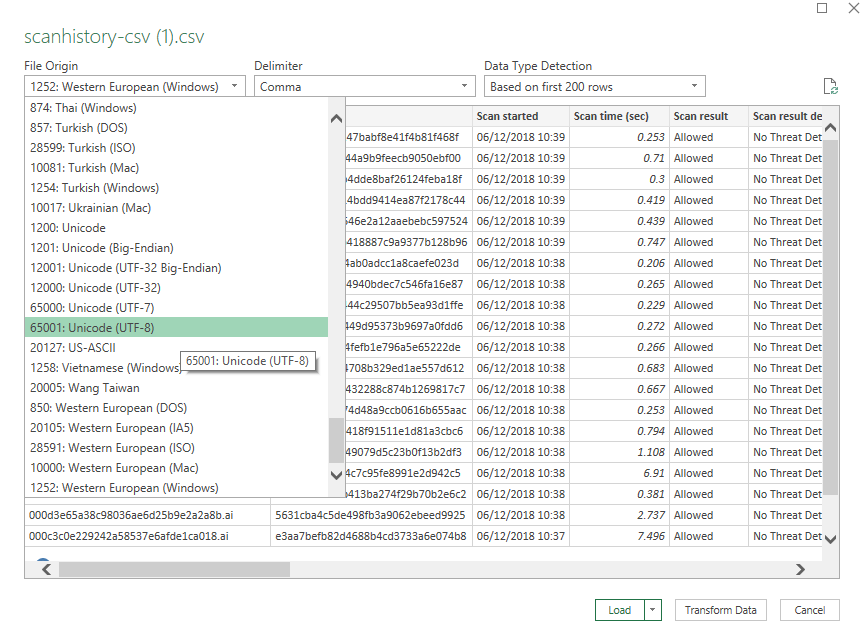
If you use Microsoft Edge for downloading CSV file. The file may have some troubles with encoding. You can solve it in this way:
-
Open Microsoft Excel as normal.
-
On the main menu, select Data → From Text/CSV → Choose the CSV.
A window will appear, on encode field, select "65001: Unicode (UTF-8)". -
Click "Load" button.

Config history
This page shows audit log that gives information about configuration changes such as user, group and instance management operations.
The events are ordered by the date field and searchable by any field.
The displayed fields are:
-
Date: date and time of the event
-
User: who has made the change (directory/username)
-
Type: the type of object that has been changed
-
Change type: the type of the change (for instance: create, edit, delete, etc.)
-
Parameter: the name of the parameter
-
Old value: the value of the changed parameter before modification
-
New value: the value of the changed parameter after modification
Processing history
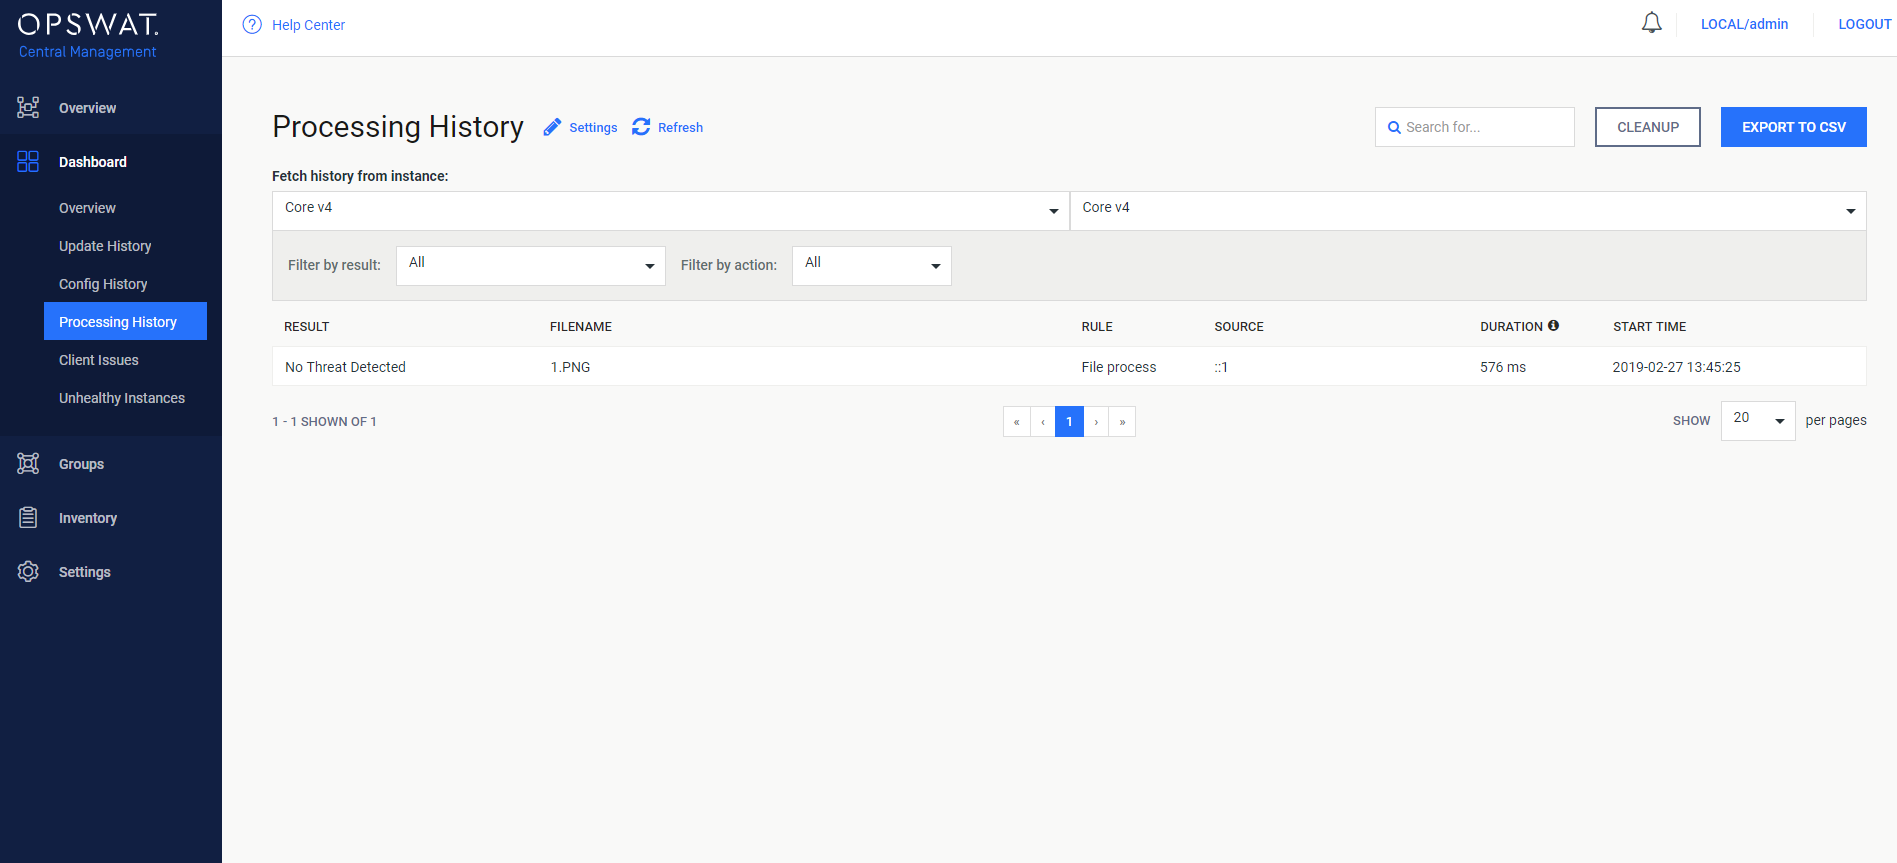
The Processing History page shows information on all scans made on the MetaDefender Core instances. The processing history is displayed associated with specific Core instance in a Group.
To fetch history from instance, select the group where the instance locates, then select the desire instance in the next drop down list.
The processing history page support following operations:
-
Search for result, source, rule and for filenames and you can limit search result for a specific scan result.
-
Clean up history that is older than a specific time range
-
Export scan history in CSV. For the export, the scan history filters will be applied. After the desired time range selected, the download will be started by clicking on the OK button.
-
Filter log by scan result, filter by action.

Unhealthy instances
Unhealthy instances shows the list of those engines of which health score is not 100 percent accompanying the following information:
-
Satus
-
Health status
-
Score
-
Address
-
Product type
-
Product version
-
License
-
Last seen
Score is an integer number between and including 0 and 100. The lower the value the more attention is needed from system administrators to take care of products having low score values. Calculation of the actual score uses the following factors:
-
Whether the instance is reachable
-
License issues such as fact of activation or expiration of the license and approaching expiry
-
If product version is the latest available version
-
If engine database is up-to-date