5.4. Reporting
Reports
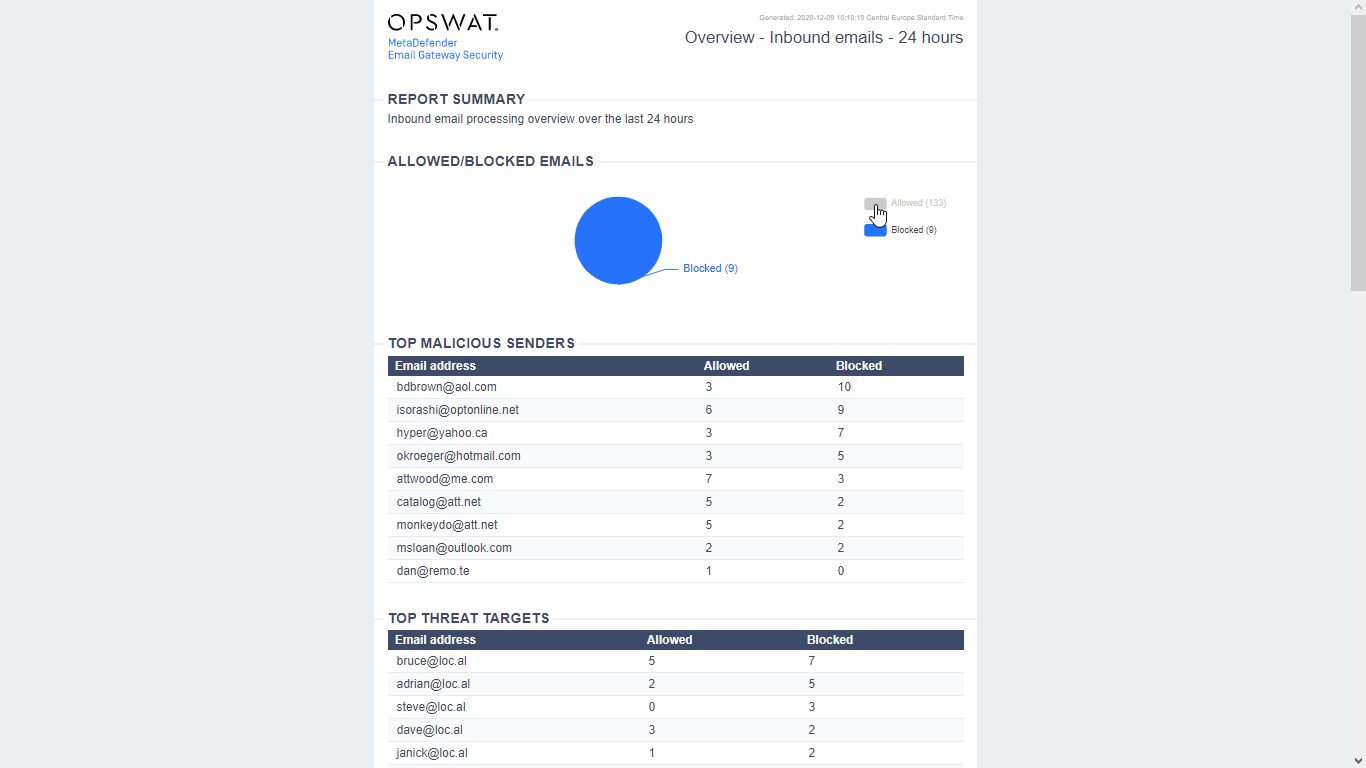
MetaDefender Email Gateway Security supports reporting the most essential processing results in a well organized, printing ready format.
The following reports are available
-
Overview - Inbound emails: the most essential inbound results similar to what we have on the 5.1. Dashboard.
-
Overview - Outbound emails: the most essential inbound results similar to what we have on the 5.1. Dashboard.
-
Allowed/Blocked emails: statistics of blocked and allowed emails for both inbound and outbound directions.
-
Top malicious senders: the top 20 sender email addresses whose emails had contents that were blocked.
-
Top threat targets: the top 20 recipient email addresses whose emails had contents that were blocked.
-
Zero-Day Malware Prevention: statistics of Deep Content Disarm and Reconstruction processing for both inbound and outbound emails.
-
Advanced Threat Prevention: statistics of Multiscanning for both inbound and outbound emails.
-
Data Loss Prevention: statistics of Proactive Data Loss Prevention processing for both inbound and outbound emails.
-
Unsolicited emails: statistics of spam, phishing and marketing emails (for details see 5.7. Phishing and spam).
-
Bypassed emails: statistics of emails that were bypassed due to different processing problems (for details see 5.5. Bypassing).
Timespans
Each of the reports above are available for the following timespans:
-
Last 24 hours,
-
Last 7 days,
-
Last 30 days.
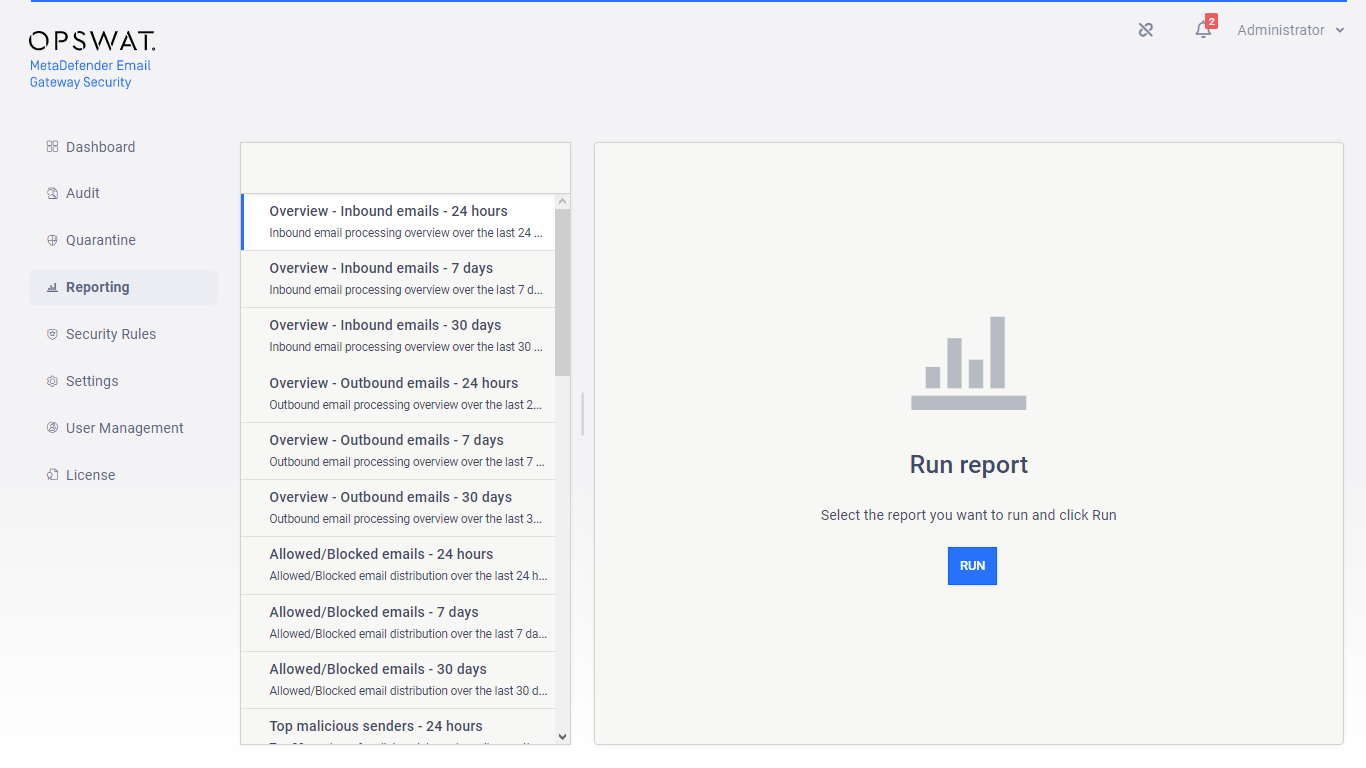
Running a report
After selecting the report and clicking the RUN button, the report is opened in a separate browser window.
Ad-blockers
Ad-blockers configured int the browser may block Email Gateway Security from opening the report window.
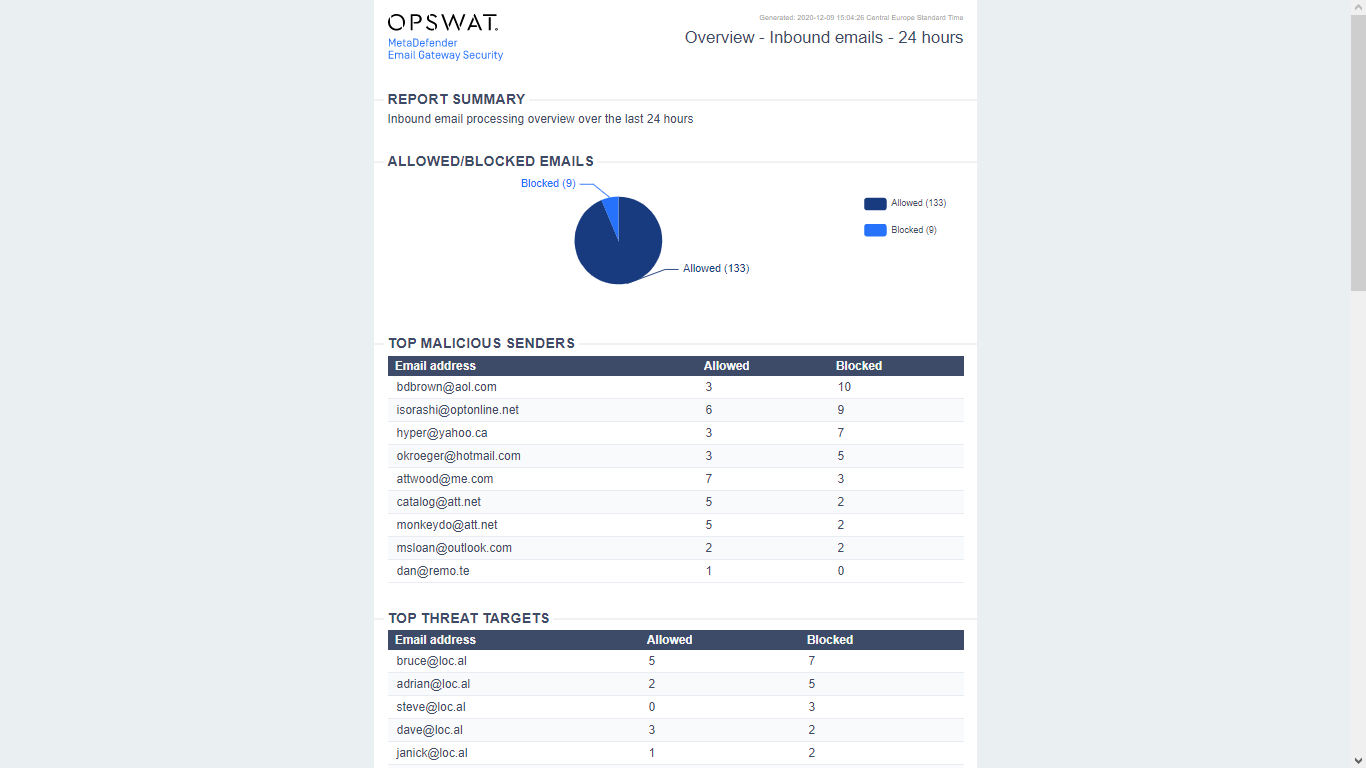
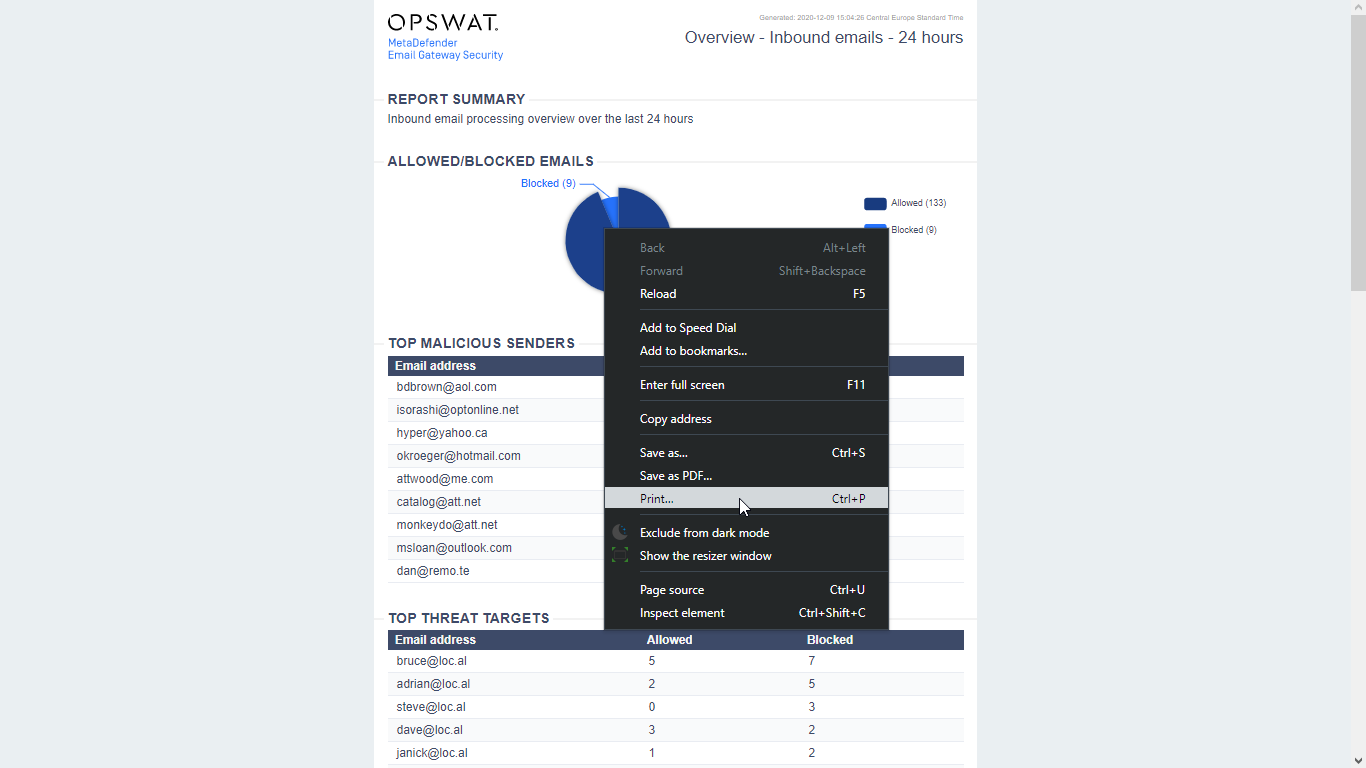
Interactive charts
The charts of the report are interactive.
Printed charts
Charts in a printed or PDF report lose their interactivity.
Hovering over a chart element will display additional information.
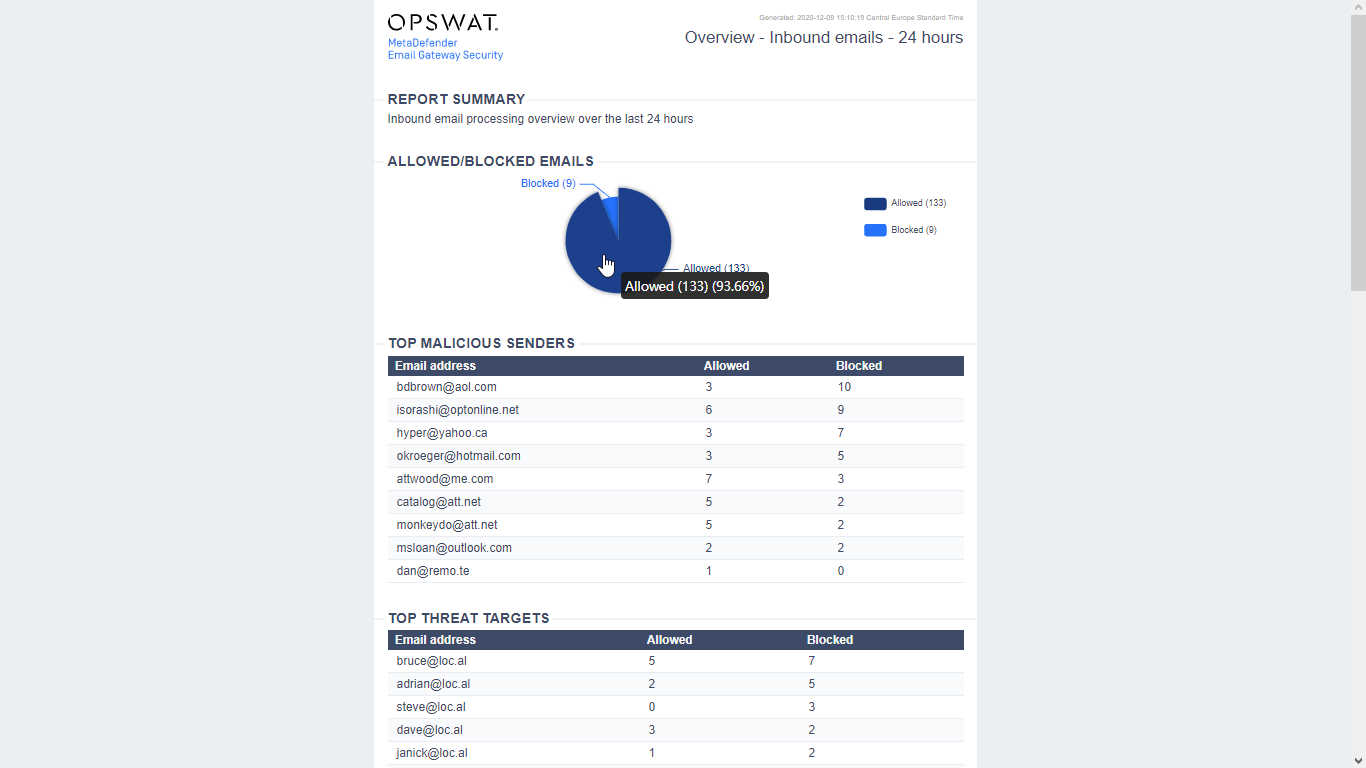
Clicking on the legend can enable or disable the appropriate element on the chart.
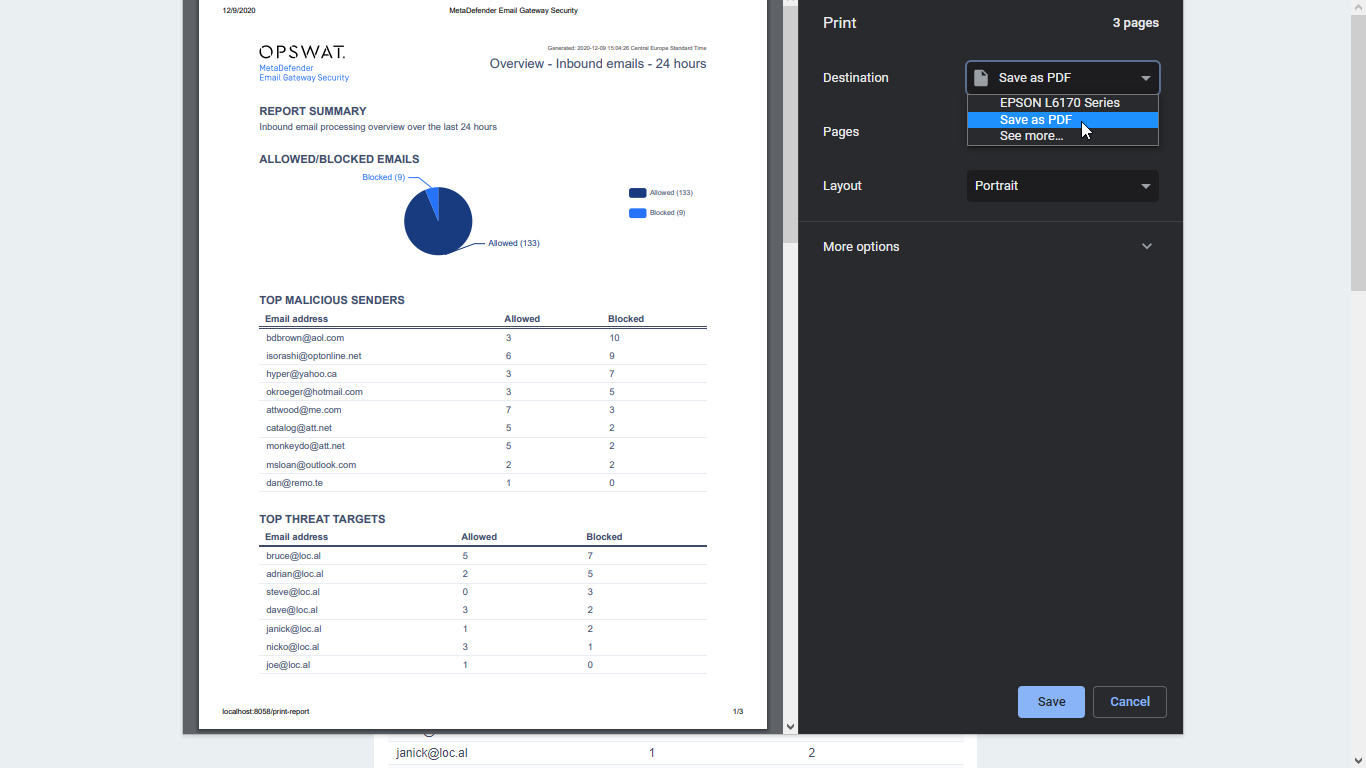
Printing a report
Style
The look or style of a printed or PDF report may be slightly different from the report in the preview window.
The structure will, however, be the same.
To print a report, use the Print function of your browser in the report preview browser window.
PDF report
To save a report in PDF format you can use the built in Save as PDF functionality of your browser.
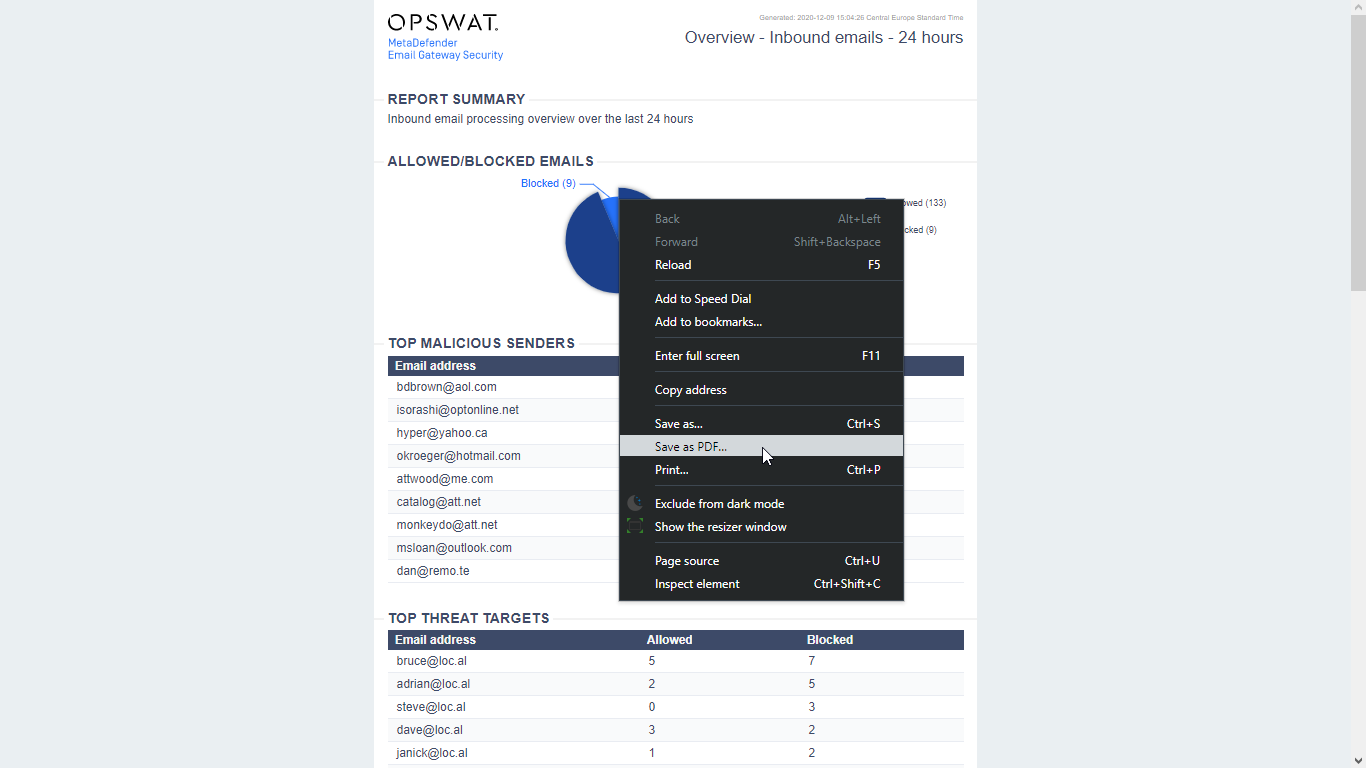
An alternative way may be to use the Save as PDF function of your browser’s print preview.